
Using a comprehensive assessment of a prescription drug’s financial impact that extends beyond gross and net prescription costs allows you to capture value from all relevant sources, including medical cost offsets from avoided complications and utilization, improvements in patient functioning and quality of life, and productivity gains for patients and caregivers. Incorporating all dimensions of value can provide a more complete picture of a drug’s overall value.
These broader value dimensions are increasingly influencing coverage and pricing decisions in both payer formulary management and federal policy. The Inflation Reduction Act (IRA) established a Medicare Drug Price Negotiation program that explicitly considers clinical benefit and therapeutic alternatives in price setting, and the Center for Medicare and Medicaid Innovation (CMMI) has published most-favored-nation–style benchmarking models, such as Global Benchmark for Efficient Drug Pricing (GLOBE) Part B and Guarding US Medicare Against Rising Drug Costs (GUARD) Part D, that link US payments to prices in economically comparable countries.
The Stakeholder Impact Model (the "Value Stack") quantifies return on investment (ROI) for beclometasone dipropionatez/formoterol fumarate/glycopyrronium bromide (BDP/FF/GP) by projecting incremental cost and value across US health care stakeholders, including health plans, pharmacy benefit managers (PBMs), patients, the government and providers. By using robust academic sources and the Actuarial Budget Impact Model, this approach provides a complete perspective of the system-wide impact of incorporating BDP/FF/GP in asthma treatments.
The Stakeholder Impact Model estimates incremental value, or “returns,” via pharmacy and medical cost savings, productivity gains and societal benefits such as reduced caregiver burden. These returns are compared to incremental cost increases, defined as the "investment" to calculate overall ROI, which is then allocated to stakeholders.
To provide a comprehensive outlook, ROIs are projected across various books of business, including commercial and Medicare, under both medical and medical-plus-pharmacy arrangements, and over multiple time frames (one, two, three and five years). Additional input assumptions and scenarios may be incorporated, allowing users to attribute projected results to different plan sizes, member or patient demographics, risk profiles, pricing strategies and other relevant dimensions.
Asthma is a chronic inflammatory disease of the airways, typically characterized by intermittent shortness of breath, coughing and wheezing. Despite significant advances in understanding genetic loci, environmental triggers and other risk factors, effective clinical strategies to prevent persistent asthma from progressing into adolescence and adulthood remain limited. Asthma is estimated to affect approximately 260 million individuals worldwide and about 25 million in the United States.[1]
Asthma imposes a substantial burden on patients and health systems, with significant societal impacts. It is associated with an increased risk of respiratory complications, reduced quality of life, decreased productivity and, in severe cases, hospitalization or death.[2]
A wide range of therapies is available, with most delivered via inhalation, as this route is generally the most effective for targeting medication directly to the lungs. Alternative routes, such as oral, injectable and infusion therapies, are also utilized but are typically reserved for long-term control and prevention.
Given the variability in asthma symptom severity, health insurance plan formularies typically include multiple asthma medications. The primary consideration is not eligibility for medication but rather the ability to select the most appropriate therapy for each individual.[3] Payers generally implement guidelines and programs to assist members in managing asthma, as with Anthem’s Chronic Condition Special Needs Plans,[4] Aetna’s Specialty Health Care Management support and Cigna’s Chronic Condition Management Program.[5]
The Global Initiative for Asthma (GINA) is an international medical organization established in 1993 in collaboration with the World Health Organization (WHO) and the National Heart, Lung, and Blood Institute. Its primary mission is to increase awareness of asthma among health professionals, public health authorities and the public, and to improve asthma prevention and management globally through evidence-based strategies.[6]
GINA outlines a five-step approach to asthma management, with increasing severity corresponding to increasingly aggressive treatment recommendations.[7] These steps enable clinicians to tailor therapy based on symptom severity, risk of exacerbations and response to previous treatment.
Each step includes both preferred and alternative treatment options, with progression up or down the steps determined by the patient’s level of control and risk. The GINA global strategy report indicates that 24% of individuals with asthma experience high-intensity, difficult-to-treat or severe disease[8]; these individuals correspond to GINA steps 4 and 5. As illustrated in Figure 1, treatment at these steps includes combination therapies and biologic options designed to address the increased severity of asthma.[9]
Figure 1
2026 Asthma Market Cap by GINA Step (Total Scripts)
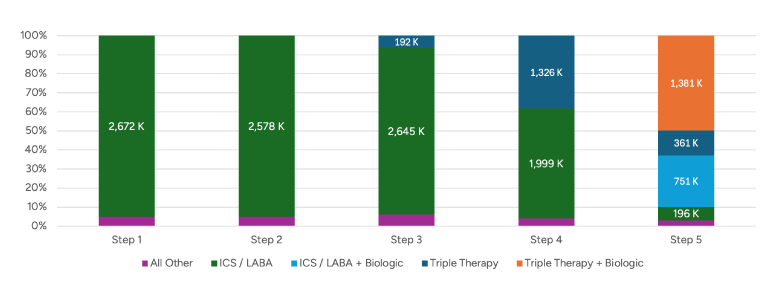
When symptoms are more frequent or difficult to control, such as asthma symptoms occurring on multiple days per week, night-time waking at least weekly, or poor control despite inhaled corticosteroids (ICS) and/or bronchodilators, clinicians may escalate to combination inhalers.
While financial considerations are important in formulary decision-making, clinicians prioritize efficacy and reductions in relative risk. In a systematic review and meta-analysis of 20 randomized clinical trials (11,894 patients) with moderate-to-severe asthma, triple therapy (ICS/long-acting beta-2 agonist bronchodilators [LABA]/long-acting muscarinic antagonists [LAMA]) was associated with a significantly lower risk of severe asthma exacerbations than dual therapy (ICS/LABA) (RR 0.83, 95% CI 0.77–0.90).[10]
In the US market, a single-inhaler ICS/LABA/LAMA product of fluticasone furoate/umeclidinium/vilanterol (FF/UMEC/VI) is indicated for the maintenance treatment of asthma in adults. On October 15, 2025, Chiesi reported Food and Drug Administration (FDA) acceptance of a New Drug Application for an investigational triple-combination inhaler (beclomethasone dipropionate/formoterol fumarate/glycopyrronium [BDP/FF/GP]) for maintenance treatment of asthma in adults. This product is marketed outside the United States as Trimbow and is currently awaiting US marketing authorization from the FDA.[11]
Within this clinical and market context, the value stack approach provides explicit accounting of the value, the stakeholders who receive it and how these returns compare to the incremental investment.
Modeling
The stakeholder value stack model is an Excel-based actuarial ROI framework designed to make the value proposition of treatments like BDP/FF/GP clear and actionable for decision-makers. Using the same assumptions as the actuarial budget impact model, it separates the incremental investment (treatment acquisition and delivery costs, net of discounts/rebates) from the incremental returns (monetized offsets and clinical benefits attributable to BDP/FF/GP), then allocates both to defined stakeholders. This model provides transparent, stakeholder-specific ROI results for BDP/FF/GP, reported over the selected time horizon with dollar and ROI outputs.
The model assumes a hypothetical plan population of asthma-diagnosed individuals and projects outcomes from 2024 through 2028. The population reflects a US-like distribution by line of business (commercial self-insured, commercial fully insured and Medicare) and asthma severity. The modeled treatment set includes BDP/FF/GP and relevant comparator therapies represented in the baseline treatment mix. In the baseline (“current world”) scenario, market shares reflect assumed status quo utilization in the absence of BDP/FF/GP. A “future world” scenario assumes BDP/FF/GP's growth in market share after the product launch. Displacement is implemented through share shifts across products/classes intended to reflect the practical effects of formulary placement and associated access friction (tiering and utilization management).
The distinguishing feature of the Value Stack Model relative to the Actuarial Budget Impact Model is the inclusion of value: medical cost offsets and non-medical/societal components linked to modeled differences in clinical events and utilization. The model translates event/utilization differences into costs using unit-cost inputs, then assigns those cost offsets to stakeholders. Medical cost value is derived from a reduction in medical adverse events, while societal and productivity value are derived from the related additional workdays and presenteeism related to that reduction in medical adverse events. Results are presented as (1) investment, (2) returns, (3) net value and (4) ROI by stakeholder and horizon, with payer-budget components kept distinct from broader societal categories rather than combined into a single headline metric.
Analysis
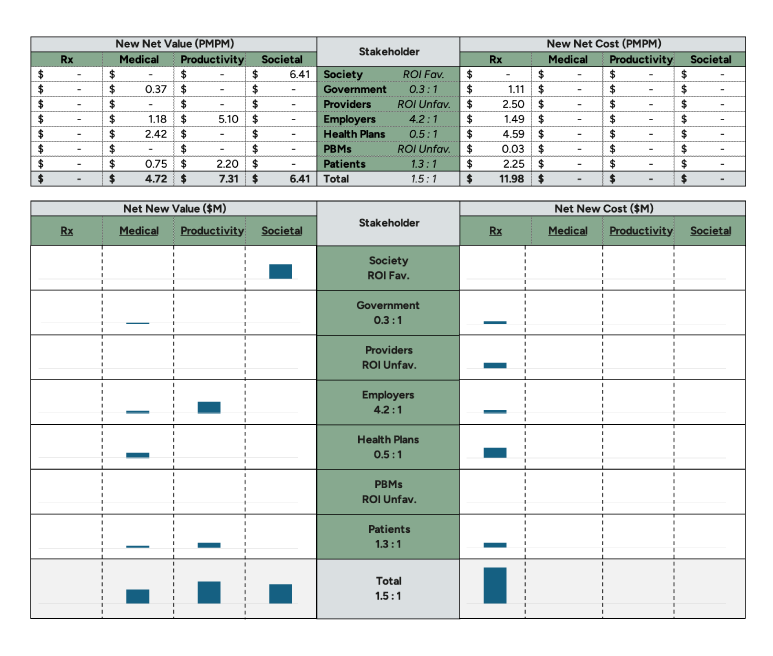
The stakeholder value stack output (Figure 2) shows an overall ROI of 1.5:1 (return:investment) over a one-year horizon, with $11.98 per member per month (PMPM) in incremental pharmacy costs (“investment”) and $18.44 PMPM in modeled “returns,” comprising $4.72 PMPM medical value, $7.31 PMPM productivity value and $6.41 PMPM societal value.
Figure 2
Stakeholder Value Stack Output
The distribution of those returns matters because several clinically meaningful outcomes of improved asthma control do not reliably translate into near-term reimbursed medical cost offsets, even when they are material to patients; relief of symptom burden, activity limitation, sleep disruption and caregiver strain, as well as improved day-to-day functioning are common examples. The model captures a large share of the benefit through productivity and societal components, with the latter first seen in better functioning, with medical offsets representing only part of the total value measured.
From the patient perspective, the 1.3:1 ROI comprises $0.75 PMPM in medical cost offsets along with $2.20 PMPM in productivity savings. Productivity savings are estimated through reduced absenteeism (missing work due to asthma symptoms) and increased presenteeism (higher productivity at work due to reduced symptom burden). These accrue to patients in the form of higher wages and to employers in the form of higher productivity. The model does not attempt to quantify quality of life beyond these direct economic impacts because of the difficulty of assigning financial value to these important, though qualitative, dynamics.
The employer result (attributable to the self-insured commercial population) is strongly favorable at 4.2:1, comprising $1.18 PMPM in medical cost offsets, $5.10 PMPM in productivity value and $1.49 PMPM in additional pharmacy costs. The medical-cost-only ROI for employers is 0.8:1, compared to 0.3:1 for patients, because drug costs are likely to fall within the deductible benefit phase (in both the commercial and Medicare lines of business), while medical cost savings generally fall above the deductible/out-of-pocket maximum. As a result of these cost and benefit design dynamics, increased pharmacy costs disproportionately accrue to patients, whereas medical cost offsets disproportionately accrue to employers, resulting in a differential medical-cost-only ROI between the two.
Health plan (attributable to fully insured commercial and Medicare Advantage populations) and government (attributable to Medicare fee-for-service population) perspectives are 0.5:1 and 0.3:1, respectively, with additional drug costs of $4.6 PMPM and $1.1 PMPM, compared to medical cost offsets of $2.4 PMPM and $0.4 PMPM, respectively. The key dynamic producing these ROIs is displacement from lower-cost single/dual therapy to triple therapy, which increases “investment,” while the financially quantifiable clinical benefits attributable to the triple-therapy class beyond those of the lower-cost single-/dual-therapy drugs (“value”) are relatively smaller.
These entities participate in the investment that produces the quality-of-life benefit accruing to patients, which the model does not attempt to quantify. In Medicare specifically, the introduction of a Maximum Fair Price (MFP)–negotiated product in the triple-therapy class resulted in significant net cost reductions in this class while portraying other products in the class as relatively higher cost. If a comparator is assumed to have a materially lower Medicare net price due to MFP, then switching to BDP/FF/GP will mechanically increase incremental prescription cost for that segment, depressing Medicare ROI even if the clinical benefits are comparable.
Society is modeled as “ROI favorable” because it benefits from reduced caregiver burden (labeled as “societal value”), while incurring no investment costs.
Finally, providers and PBMs are modeled as “ROI unfavorable” due to 340B economics (the government program that allows providers to purchase prescription drugs at a discounted rate and dispense them at the normal rate, retaining the margin). This is a purely channel-economics dynamic rather than a clinical dynamic. The triple-therapy class is heavily rebated, resulting in low 340B acquisition prices and large 340B margins for 340B contract entities and PBMs participating in those margins. BDP/FF/GP is expected to be priced lower (in terms of its list price) compared to other products in the triple-therapy class, resulting in lower 340B margins. Additionally, the introduction of an MFP product into the triple-therapy class significantly reduces the 340B margins that providers and PBMs accrue.
These results indicate that the modeled clinical benefits translate into monetized value across stakeholders, but that conventional payer and government budget perspectives capture only a subset of that value because several meaningful benefits of improved asthma control manifest as functional gains and other non-budgetary returns, while incremental prescription investment is most sensitive to the assumed displacement mix and to program-specific net-cost attribution (rebates, MFP and 340B mechanics).
Uncertainty in the modeled overall ROI was evaluated using a deterministic two-way sensitivity analysis. Each parameter listed in the tornado plot in Figure 3 was varied independently within prespecified lower and upper bounds, while all other inputs were held at base-case values. For each sensitivity-adjusted variable, the model was re-run, and the resulting overall ROI was recorded. The plotted bars represent the ROI at the lower and upper bounds for that parameter’s lower and upper bounds.
Figure 3
Change in Overall ROI (Base 1.6:1.0)
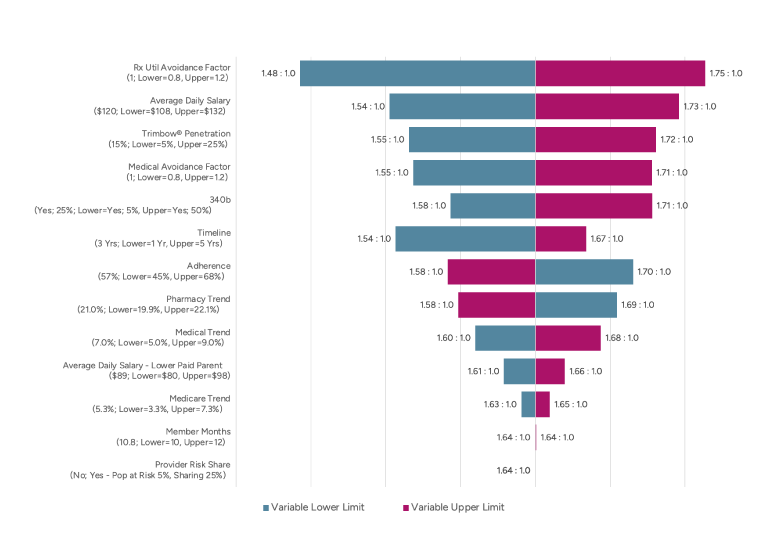
The two most sensitive dynamics relate directly to the value created by BDP/FF/GP: medical cost offsets (Rx Util Avoidance Factor) and average daily salary (correlated with reduced absenteeism savings and increased presenteeism value). A ±20% change in medical cost offsets results in moving ROI from 1.64:1 to 1.48:1 and 1.75:1, respectively, while a similar change in average daily salary results in narrower changes of 1.54:1 and 1.73:1, respectively.
Other variables modeled showed less variability, with generally symmetric effects. One slight exception is the time frame: modeling different time frames (one, two and five years around the initial assumption of three years) results in higher ROI as additional medical costs accrue and the assumed medical cost trend outpaces the pharmacy net cost trend (consistent with historical averages).
Conclusion
An additional triple-therapy option in the US market could create value for all stakeholders. A new product with a distinct ingredient composition and device/delivery profile can expand clinicians’ options for matching therapy to patient needs. To the extent improved control translates into fewer exacerbations and better day-to-day functioning, the benefits extend beyond the pharmacy budget and can be reflected in outcomes that matter to patients and those who bear indirect costs. If approved by the FDA, health plans might be wise to consider using comprehensive value analyses such as the one presented in this value stack when deciding whether to include BDP/FF/GP in their formularies.
This article is provided for informational and educational purposes only. Neither the Society of Actuaries nor the respective authors’ employers make any endorsement, representation or guarantee with regard to any content, and disclaim any liability in connection with the use or misuse of any information provided herein. This article should not be construed as professional or financial advice. Statements of fact and opinions expressed herein are those of the individual authors and are not necessarily those of the Society of Actuaries or the respective authors’ employers.
Jacqueline Leier, FSA, MAAA, is a consulting actuary at Axene Health Partners. Jacqueline can be reached at jacqueline.leier@axenehp.com.
Endnotes
[1] Jennifer Goldin and Mary E. Cataletto, “Asthma,” StatPearls (StatPearls Publishing, 2024), https://www.ncbi.nlm.nih.gov/books/NBK430901/.
[2] Global Initiative for Asthma, Global Strategy for Asthma Management and Prevention for Adults and Children Older than 5 Years: A Pocket Guide for Health Professionals, updated 2020, https://ginasthma.org/wp-content/uploads/2020/04/Main-pocket-guide_2020_04_03-final-wms.pdf.
[3] Global Initiative for Asthma, “Global Strategy for Asthma Management and Prevention,” updated November 15, 2025, https://ginasthma.org/2025-gina-strategy-report/.
[4] Anthem Blue Cross and Blue Shield, “Chronic Condition Special Needs Plans (C-SNPs) from Anthem,” (n.d.), https://www.anthem.com/medicare/medicare-advantage-plans/special-needs-plans/chronic-special-needs-plans.
[5] Cigna Healthcare, “Chronic Condition Management Overview,” (n.d.), https://static.cigna.com/assets/chcp/resourceLibrary/medicalResourcesList/medicalClinicalHealthandWellness/medicalClinHealthWellCCOverview.html.
[6] Louis-Philippe Boulet, et al, “The Global Initiative for Asthma (GINA): 25 Years Later,” Eur Respir J 54, no. 2 (2019): 1900598, https://publications.ersnet.org/content/erj/54/2/1900598.
[7] Global Initiative for Asthma, Global Strategy.
[8] Maria Elisa Di Cicco, et al, “Intermittent and Mild Persistent Asthma: How Therapy Has Changed,” Acta Biomed 92, supplement 7 (2021): e2021523, https://pubmed.ncbi.nlm.nih.gov/34842585/.
[9] CRA ‘23 and ‘24 Research and Analysis, Projected IQVIA TRx Data 2018-2024.
[10] Lisa H. Y. Kim, et al, “Triple vs Dual Inhaler Therapy and Asthma Outcomes in Moderate to Severe Asthma: A Systematic Review and Meta-analysis,” JAMA, vol. 325, no. 24 (2021): 2466–2479, https://jamanetwork.com/journals/jama/fullarticle/2780374.
[11] Chiesi USA, “Chiesi Announces FDA Acceptance of New Drug Application for Its Triple Combination Inhaler for the Maintenance Treatment of Asthma,” GlobeNewswire, October 15, 2025, https://www.globenewswire.com/news-release/2025/10/15/3167051/0/en/Chiesi-Announces-FDA-Acceptance-of-New-Drug-Application-for-its-Triple-Combination-Inhaler-for-the-Maintenance-Treatment-of-Asthma.html.